
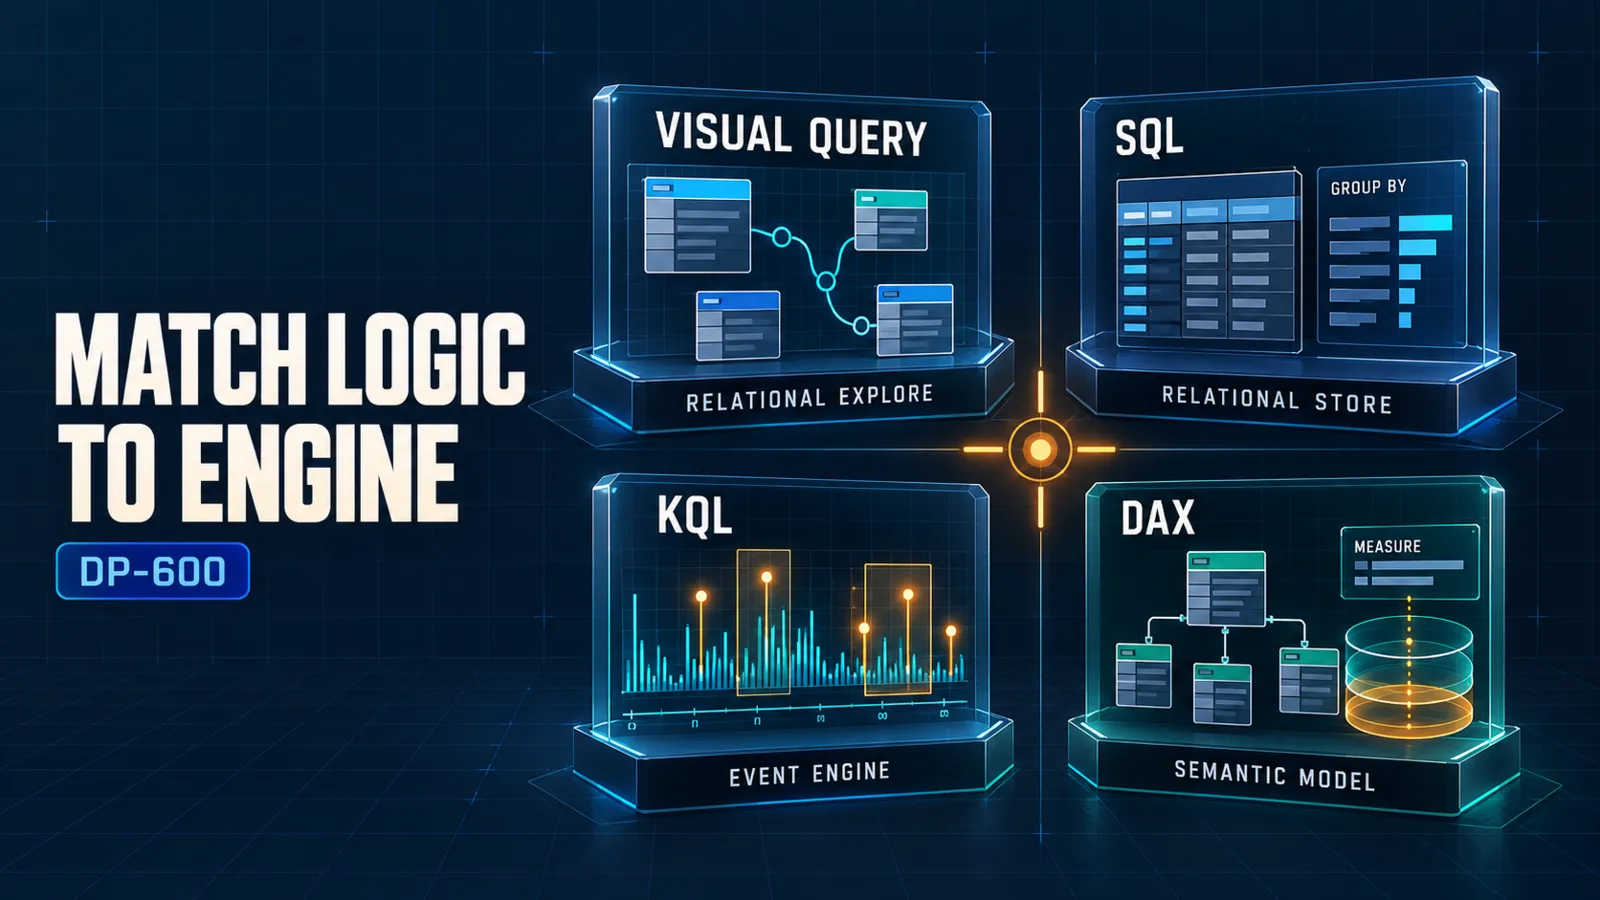
Choose the query surface by the engine that owns the data and the kind of result the reader needs. Use the Visual Query Editor for guided relational exploration, Structured Query Language (SQL) for reusable relational queries, Kusto Query Language (KQL) for time-oriented event analysis, and Data Analysis Expressions (DAX) for calculations evaluated through a Power BI semantic model. These tools can all filter and aggregate data, but they operate at different layers and are not interchangeable syntax choices.
The practical decision is therefore not “which language is best?” It is “where should this logic live?” Source-oriented shaping and relational result sets belong close to the analytical store. Event sequences and telemetry patterns belong in the Kusto engine. Reusable business measures belong in the semantic layer. A visual interface is useful when it accelerates discovery without hiding the execution boundary.
Start with the Analytical Layer
Microsoft Fabric combines several analytics engines over a shared platform. A Warehouse exposes a relational surface designed for T-SQL workloads. A lakehouse provides Spark access and a SQL analytics endpoint over registered Delta tables. An Eventhouse is designed for real-time and event data queried with KQL. A Power BI semantic model provides relationships, measures, and business metadata evaluated with DAX.
That architecture gives the first selection rule:
| Query surface | Primary layer | Best fit | Typical output |
|---|---|---|---|
| Visual Query Editor | Relational analytical item | Interactive, low-code selection, filtering, joins, and aggregation | Preview or generated relational query result |
| SQL | Warehouse or SQL analytics endpoint | Reusable relational logic, set operations, grouping, views, and database-side computation | Rows and columns |
| KQL | Eventhouse or KQL database | Time-series, telemetry, log, sequence, and high-volume event exploration | Tabular event analysis |
| DAX | Power BI semantic model | Context-aware measures, reusable business metrics, and semantic analysis | Scalar or tabular semantic result |
The current DP-600 study guide expects candidates to select, filter, and aggregate with all four surfaces. That scope rewards engine awareness: an identical-looking sum can have different semantics depending on whether it is computed over source rows, an event stream, or a filtered semantic model.
Use the Visual Query Editor for Guided Relational Exploration
The Visual Query Editor is appropriate when a user needs to inspect relational data and express supported read-only operations without beginning in code. Its diagram experience supports visual query construction, including table merges, and can expose the resulting T-SQL when the applied steps can be translated. The visual representation is especially helpful during exploration, collaborative walkthroughs, or validation of a simple relational result.
Treat it as an interface to an underlying engine, not as a separate data-processing architecture. Before accepting a result, identify the item being queried, inspect the generated logic when the experience exposes it, and confirm that joins and filters have the intended cardinality. A visual join that multiplies rows produces the same analytical error as a handwritten join.
Move from visual exploration to a maintained SQL object when the logic must be reused, reviewed as code, secured at the database-object level, or consumed by multiple downstream assets. Keep the visual approach when it makes a one-off or low-complexity query clearer and the generated result remains easy to validate.
Use SQL for Relational Sets and Reusable Store Logic
SQL is the natural choice when the question is relational: which rows qualify, how tables join, how groups aggregate, or which reusable view should expose a curated result. A Fabric Warehouse is designed for SQL-first analytical development. A lakehouse SQL analytics endpoint also supports T-SQL querying over Delta tables, but it is a read-oriented analytical surface rather than a substitute for every writable Warehouse capability.
Typical SQL responsibilities include:
- Selecting only the columns required by a consumer.
- Filtering rows before they reach a downstream model.
- Joining facts to dimensions or conforming reference data.
- Grouping at a deliberate business grain.
- Creating a view that exposes stable relational logic.
- Validating counts, nulls, duplicates, and referential assumptions.
The Fabric storage guidance distinguishes the SQL-oriented Warehouse from the Spark-oriented lakehouse and the event-oriented Eventhouse. Apply that distinction before copying a query pattern. For example, a view over a Warehouse can be a useful governed serving object, while a lakehouse SQL analytics endpoint has a different write boundary and supported surface.
Avoid pushing every business measure into SQL merely because the source is relational. A customer lifetime value calculation that must respond to report filters, dates, and user selections may belong in DAX. Conversely, do not force expensive row-level cleansing or repeated relational joins into DAX when the analytical store can produce a reusable clean structure.
Use KQL for Time-Oriented Event Analysis
Kusto Query Language is designed for the event and telemetry workloads represented by Real-Time Intelligence and Eventhouse. It is a strong fit when time is a primary analytical axis and questions involve event windows, rates, sequences, anomalies, logs, or rapidly arriving records.
A useful KQL pipeline usually reads from left to right: start with an event table, restrict time and other predicates early, project the needed fields, derive values, and summarize at the intended interval or category. This pipeline style makes the transformation sequence explicit and supports iterative exploration.
The Real-Time Intelligence overview positions Eventhouse as the store for real-time analytical data. Use KQL there instead of translating an event problem prematurely into a relational warehouse pattern. For example, counting failures per five-minute interval and correlating them with device identifiers is naturally event-oriented; producing a governed monthly financial statement is not.
KQL results can feed downstream reporting, but that does not make every report calculation a KQL responsibility. Use KQL to reduce and shape event data at the event engine. Use the semantic layer to define reusable business measures across curated results when report filter context matters.
Use DAX for Semantic and Context-Aware Calculations
Data Analysis Expressions operates inside a semantic model. DAX measures are evaluated in filter context created by report filters, slicers, visual axes, relationships, and the query itself. This makes DAX the right place for reusable business calculations that must respond consistently to how users explore the model.
Use DAX for responsibilities such as:
- Ratios and percentages that must respond to filter context.
- Time-based comparisons over a properly designed date dimension.
- Measures reused across reports and analytical experiences.
- Conditional calculations that rely on semantic-model relationships.
- Tabular queries or diagnostics against the semantic model.
The semantic model should already have a sound star schema and unambiguous relationship behavior. DAX cannot compensate reliably for unclear grain or accidental many-to-many propagation. The Power BI modeling guidance organizes official recommendations for star schemas, relationships, DirectQuery, DAX, and performance.
Keep row-by-row data preparation out of measures when it can be performed once upstream. A measure is recalculated under query context; repeated source-cleaning logic in DAX can be harder to maintain and can make performance diagnosis more difficult. Continue with DP-600: Designing Power BI Semantic Models and Relationships in Microsoft Fabric before building complex measures, then use DP-600: Advanced DAX Patterns for Enterprise Semantic Models for calculation design.
Compare the Same Analytical Request Across Surfaces
Consider a request to show revenue by region and month, then investigate an unexpected drop.
The relational store can use SQL—or a visual query that produces equivalent relational logic—to validate source rows, join sales to region and date dimensions, and aggregate at a known grain. If the drop is associated with application events or streaming transactions, KQL can analyze failures, latency, or event counts around the affected time window. The semantic model can expose a DAX revenue measure and prior-period comparison that responds to report filters.
These are complementary computations:
- SQL establishes a trusted relational dataset and validates data shape.
- KQL investigates event evidence when the diagnostic question is time-series oriented.
- DAX defines the governed business metric and comparison behavior.
- The Visual Query Editor can accelerate an exploratory relational step when its generated logic remains transparent.
Repeating all logic in every surface creates reconciliation problems. Assign each rule to the lowest appropriate reusable layer, document its owner, and expose only the result needed by the next layer.
Common Selection Mistakes
Choosing by familiarity instead of engine
Writing SQL-like logic everywhere can force event analysis or semantic calculations into the wrong execution model. Start with the item and engine, then choose the language.
Treating DAX as data-cleaning code
DAX is strongest for model-aware calculations. Clean invalid types, duplicates, and malformed source rows upstream so every semantic consumer receives the same corrected data. See DP-600: Transforming and Cleaning Data in Microsoft Fabric for that boundary.
Ignoring grain before aggregation
An aggregate is only meaningful when the input grain is known. Confirm join cardinality and row uniqueness before grouping in SQL, summarizing in KQL, or evaluating a DAX measure.
Assuming a visual query needs no review
A visual canvas reduces syntax work, not analytical risk. Review joins, filters, data types, and generated logic with the same care as handwritten code.
Duplicating business logic
If a metric must be consistent across reports, define it once in the governed semantic model. If a relational transformation must serve several models, define it once in the analytical store. Duplication makes future changes difficult to reconcile.
Build Query Fluency with One Scenario
A useful practice exercise uses one business process across all four surfaces. Load a small sales and operations dataset. Use the Visual Query Editor to explore tables and validate a simple group. Reproduce and extend the logic in SQL as a maintained relational query. Load event records into an Eventhouse and use KQL to summarize operational failures by time window. Finally, build a semantic model and create DAX measures that respond to region, product, and date filters.
For each result, record the input grain, engine, filter location, aggregation location, and intended consumer. The exercise is complete when you can explain why each piece of logic lives where it does—not merely when every tool returns a number.
Conclusion
Use the Visual Query Editor to accelerate transparent relational exploration, SQL to implement reusable set-based logic, KQL to investigate time-oriented events, and DAX to define context-aware semantic calculations. The most important DP-600 skill is recognizing the execution boundary and placing logic in the layer where it is easiest to govern, reuse, validate, and optimize.
Authoritative Sources
- Study guide for Exam DP-600
- Data storage options in Microsoft Fabric
- Query using the visual query editor
- What is Real-Time Intelligence in Microsoft Fabric?
- Power BI guidance documentation