
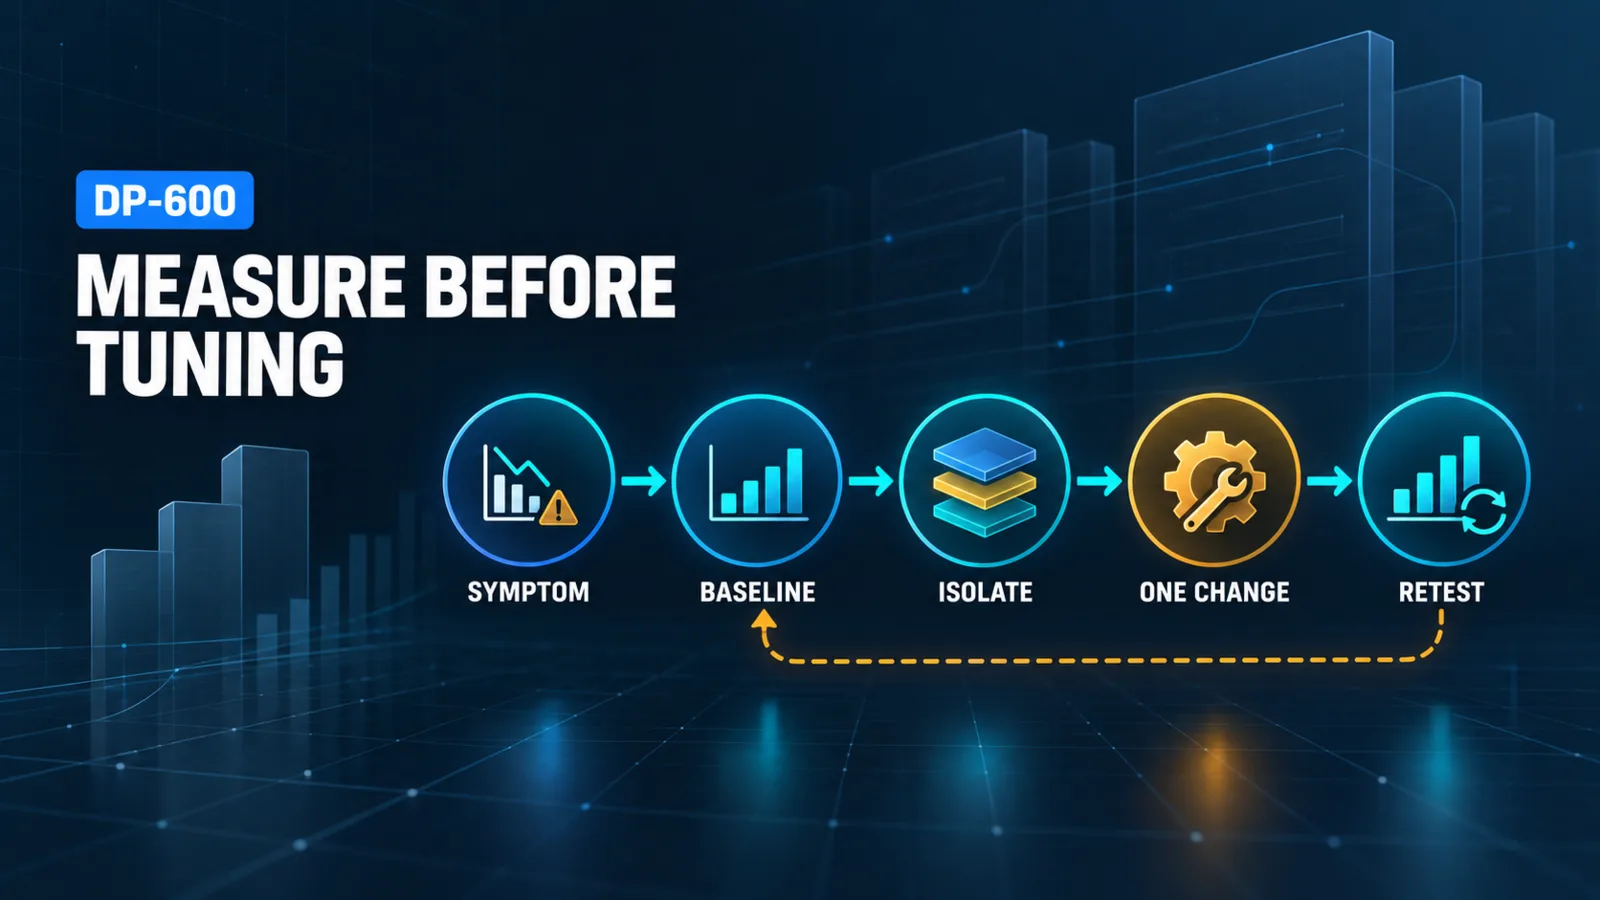
The reliable way to troubleshoot an enterprise Power BI semantic model is to begin with a measurable symptom, reproduce it under controlled conditions, and locate the delay in the visual, Data Analysis Expressions (DAX), model, source or storage path, refresh process, or capacity layer before changing anything. A slow visual is not automatically a DAX problem, and a long refresh is not automatically a source problem. The same visible delay can originate in different layers, so the first fix should be better evidence rather than a speculative redesign.
Use a measure-first workflow: record a baseline, isolate one workload, identify the responsible layer, make one targeted change, and repeat the same measurement. For slow visuals, work from the report interaction toward the source. For refresh failures, follow the path from policy and partitions through generated source queries to capacity execution. When Direct Lake is involved, first identify whether the model uses Direct Lake on OneLake or Direct Lake on SQL endpoints, because fallback behavior and the correct diagnostic interpretation differ between those architectures.
Troubleshooting Methodology: Measure Before You Tune
A performance investigation needs a stable test case. Record the workspace and semantic model, report page, filters, user identity or security role, expected result, test time, storage mode, and whether the first execution is cold or repeated. For refresh incidents, record the refresh type, affected table or partition, source window, duration, failure message, and whether the problem affects an initial or subsequent refresh.
Then apply this loop:
- Reproduce one symptom with a representative query, visual interaction, or refresh operation.
- Establish a baseline with elapsed time and the relevant engine or refresh evidence.
- Reduce the workload until the symptom disappears. Remove visuals, filters, measures, columns, or refresh partitions one at a time.
- Assign the bottleneck to the narrowest supported layer.
- Change one design choice, repeat the same test, and compare it with the baseline.
- Retain the change only when it improves the target metric without harming correctness, freshness, security, or another workload.
This discipline matters because caches, concurrent workloads, and capacity conditions can make an uncontrolled before-and-after test misleading. Compare like with like, and test both first-use and repeated-use behavior when users experience both.
Map Each Symptom to the Most Likely Layer
Start with the symptom pattern rather than a favorite optimization technique.
| Observed pattern | First layer to isolate | Useful evidence | Avoid assuming |
|---|---|---|---|
| One visual is slow while neighboring visuals are fast | Visual query and its measures | Visual execution timing, generated DAX query, visual fields and interactions | The entire semantic model is slow |
| Several visuals using the same measure are slow | DAX and model relationships | Measure timings, filter context, storage-engine versus formula-engine work | More capacity will repair inefficient logic |
| Many unrelated queries slow down together | Capacity or shared source | Time correlation, concurrency, throttling or resource-pressure evidence | Every report regressed independently |
| DirectQuery visuals are slow but imported data is responsive | Source query and network path | Source query duration, folding, indexes or data distribution, gateway path where applicable | Visual formatting is the primary cause |
| Direct Lake queries unexpectedly use another path or fail | Direct Lake architecture and guardrails | Model architecture, query mode, fallback or guardrail evidence | All Direct Lake models fall back in the same way |
| Refresh duration grows with retained history | Incremental-refresh policy, folding, and partitions | Partition ranges, source queries, rows processed, initial versus later refresh | The incremental policy guarantees reduced source work |
The Optimization guide for Power BI organizes performance work across data source, model, visual, and environment concerns. Treat those as connected layers: a report visual generates a semantic query, the model resolves relationships and calculations, the storage path retrieves data, and the capacity schedules and executes the work.
Diagnose Slow Report Visuals
Separate visual overhead from query time
Begin with the report page. Compare the slow visual with a simple visual that uses the same measure and filters. If the simpler visual is fast, reduce the slow visual's categories, conditional formatting, custom interactions, tooltips, and high-cardinality fields. Too many visuals on one page can also create many concurrent queries, so test the suspect visual alone before tuning the model.
Power BI Performance Analyzer can help distinguish DAX query time from visual display and other processing. Capture the visual's query, repeat it with controlled filters, and compare first and subsequent executions. A slow display phase points toward visual complexity; a slow query phase moves the investigation into DAX, relationships, storage, or the source.
Check filter and interaction fan-out
Slicers and cross-highlighting can cause one action to refresh many visuals. Disable unnecessary interactions temporarily and observe whether the delay belongs to one query or to the number of queries triggered. High-cardinality slicers and visuals that request many detailed groups increase work even when each individual measure is simple.
Do not declare success after making a page visually simpler if it no longer answers the business question. The target is less unnecessary work, not less useful analysis.
Isolate Inefficient DAX and Model Work
Start with the slow measure
Replace complex measures in the suspect visual with a simple base aggregation. If performance improves, restore the calculation in stages and locate the expression that changes the timing. Inspect repeated subexpressions, iterators over large intermediate tables, broad table filters, context transitions, and calculations that request more detail than the visual needs.
DAX variables can prevent repeated evaluation and make execution paths easier to inspect, but a variable is not a performance guarantee. Validate the result after every rewrite: an expression that is faster but changes filter context or totals is not an optimization. The detailed construction of variables, iterators, and table filters is covered in DP-600: Advanced DAX Patterns for Enterprise Semantic Models; this workflow uses measurement to decide which calculation actually needs revision.
Test the model structure behind the measure
When several measures show the same slowdown, inspect model-level causes. Confirm that relationships reflect the intended grain and filter direction. Remove unused columns where doing so is safe, prefer appropriately typed columns, and reduce unnecessary high-cardinality data. A wide fact table, verbose text columns, duplicated business attributes, and excessive precision can enlarge an imported model and make scans more expensive.
Model reduction has functional consequences. Before removing columns or changing data types, check report dependencies, sort-by columns, relationships, security rules, calculations, and downstream clients. In enterprise models, use impact analysis and a rollback plan rather than treating size reduction as a purely mechanical cleanup.
Trace Source Queries and Storage Paths
DirectQuery and source bottlenecks
For DirectQuery tables, a semantic query can translate into one or more source queries. Capture the source-side duration and compare it with the total visual time. If the source dominates, investigate whether transformations fold, whether filters reach the source, whether joins operate at compatible grains, and whether the source can support the concurrency generated by the report.
A model-side rewrite cannot compensate for every source limitation. Conversely, adding source resources may not help when the model emits unnecessarily broad queries. Reduce selected columns and rows, preserve query folding where it applies, aggregate at a useful grain, and retest the exact report interaction. Coordinate indexing, distribution, or physical source changes with the source owner because those changes can affect other workloads and cost.
Direct Lake fallback and guardrail diagnosis
Direct Lake reads Delta table data in OneLake without importing a separate copy into the semantic model. Before diagnosing an unexpected query path, identify the model type. Direct Lake on SQL endpoints can use DirectQuery fallback in documented situations, whereas Direct Lake on OneLake does not use DirectQuery fallback; exceeding supported guardrails there can result in query failure. The Direct Lake overview distinguishes the two architectures, and How Direct Lake works describes framing, data loading, guardrails, and fallback behavior.
Use that boundary to interpret evidence:
- For Direct Lake on SQL endpoints, determine whether the slow query actually remained on the Direct Lake path or fell back to DirectQuery. If it fell back, find the documented trigger before tuning DAX around the slower path.
- For Direct Lake on OneLake, treat a guardrail-related query failure as a model or data-layout issue to resolve, not as evidence of a hidden DirectQuery fallback.
- In either architecture, check table size, column use, data types, file and row-group organization, model framing, security configuration, and capacity conditions against the applicable documentation.
Do not switch architecture as the first troubleshooting action. The architecture decision includes security and source-access consequences beyond performance. Use DP-600: Direct Lake Architecture, Refresh, Fallback, and Security to confirm those boundaries, then apply the measured optimization at the failing layer.
Distinguish Capacity Pressure from Model Defects
A semantic model can be efficient in isolation and still slow when capacity resources are contested. Suspect a capacity layer when unrelated models regress during the same time window, failures appear only under concurrency, or the same query is stable off-peak but unstable during ingestion, refresh, or reporting peaks.
Correlate query and refresh timestamps with other Fabric workloads, concurrency, resource utilization, throttling, and queued work. Repeat the same query under comparable cache conditions at quiet and busy times. If capacity pressure is confirmed, reduce avoidable concurrency, schedule heavy refreshes away from interactive demand where possible, or evaluate capacity sizing. Scaling is justified when evidence shows sustained resource pressure after inefficient queries and models have been addressed; it should not be used to hide a single pathological measure.
Capacity changes can increase cost and can shift, rather than remove, contention. Establish workload-level service expectations and compare interactive-query and refresh performance after any scheduling or sizing change.
Troubleshoot Incremental Refresh by Partition
Incremental refresh reduces repeated processing only when the policy, date filtering, source query, and generated partitions work together. The Incremental refresh for semantic models documents the RangeStart and RangeEnd parameters, policy configuration, partition management, and optional real-time DirectQuery partition.
Separate initial refresh from later refreshes
The first service refresh creates and loads the historical and incremental partitions, so it can be substantially more demanding than a later refresh that processes only the configured window. Diagnose these cases separately. A long initial load may reflect the amount of retained history; a long subsequent refresh may indicate that filters are not reaching the source, too many partitions are being processed, or change detection and source queries are doing more work than intended.
Verify the policy and source filters
Confirm that RangeStart and RangeEnd are defined with the expected date/time type and are applied to the intended date column with non-overlapping boundary logic. Check that the policy's archive and refresh windows match the business requirement. Where query folding is expected, verify it rather than assuming that parameterized filters guarantee folding. A non-folding transformation can force the source or mashup engine to scan far more data than the selected refresh range suggests.
Inspect generated partitions and their ranges after the service applies the policy. Compare rows and duration by partition, and test the source query for the specific slow range. Check late-arriving data, time-zone handling, changed source values, credentials, gateway dependencies where applicable, and source timeouts. If only one partition fails, troubleshoot that slice before modifying the whole model.
Keep storage architectures distinct
Incremental refresh is a partition-processing strategy for applicable semantic-model tables; it is not a general remedy for every storage mode. Direct Lake framing and OneLake data visibility follow the Direct Lake architecture, so diagnose those behaviors through the Direct Lake path rather than applying an import-refresh explanation. Similarly, a DirectQuery table retrieves data from its source at query time, although an incremental-refresh policy can optionally include a real-time DirectQuery partition in supported configurations.
Resolution Workflow and Regression Checks
After locating the bottleneck, match the remediation to the evidence:
- Simplify a visual or reduce interactions when visual rendering or query fan-out dominates.
- Rewrite only the measured DAX expression when formula work dominates, then verify totals and filter behavior.
- Reduce unused or high-cardinality model data when model size and scan cost are responsible.
- Improve folding, source filtering, aggregation, or physical source design when source execution dominates.
- Resolve the documented fallback trigger or guardrail condition when Direct Lake evidence identifies it.
- Reschedule workloads or reassess capacity only when correlated resource evidence shows contention.
- Correct policy, parameter, folding, or partition problems when incremental-refresh evidence isolates the refresh layer.
Repeat the original test after the change. Also run representative security roles, common filters, peak-concurrency patterns, cold and warm executions, scheduled refreshes, and dependent reports. Record the baseline, change, result, and rollback route so another engineer can reproduce the decision.
Best Practices for Sustainable Performance
- Define a small set of representative visual and refresh benchmarks before a model reaches production.
- Monitor trends rather than waiting for user reports; duration growth often reveals data-volume or concurrency changes before a failure.
- Keep measures readable and testable, and optimize only after identifying a real bottleneck.
- Remove unused model data deliberately and review dependencies before deploying structural changes.
- Treat source, semantic model, report, and capacity ownership as one diagnostic chain with clear escalation points.
- Recheck Direct Lake and incremental-refresh behavior against current documentation because Microsoft Fabric and Power BI are continuously updated cloud services.
- Validate performance changes alongside correctness, security, freshness, cost, and maintainability.
Certification Relevance
The current DP-600 scope includes optimizing enterprise-scale semantic models, DAX, report visuals, Direct Lake behavior, and incremental refresh. The transferable skill is not memorizing one tuning feature; it is selecting evidence that separates a report issue from a calculation, model, source, storage, refresh, or capacity issue.
Practice with a controlled workload: establish a slow visual or refresh baseline, isolate the layer, apply one correction, and document the result. This demonstrates the operational reasoning expected of a Fabric analytics engineer without relying on reconstructed exam questions.
Conclusion
Semantic-model troubleshooting is most effective when it moves from symptom to layer and from measurement to a single justified change. Slow visuals should be decomposed into display, DAX, model, source or storage, and capacity work. Refresh incidents should be decomposed into policy, query folding, partitions, source execution, and shared-resource conditions.
The architecture boundary remains essential: Direct Lake on SQL endpoints and Direct Lake on OneLake do not share the same fallback behavior, and incremental refresh does not replace Direct Lake framing. Preserve those distinctions, retest the original workload, and accept an optimization only when it improves performance without compromising correctness, freshness, security, or cost.
Authoritative Sources
- Study guide for Exam DP-600
- Optimization guide for Power BI
- Power BI guidance documentation
- Semantic model modes in the Power BI service
- Direct Lake overview
- How Direct Lake works
- Incremental refresh for semantic models