
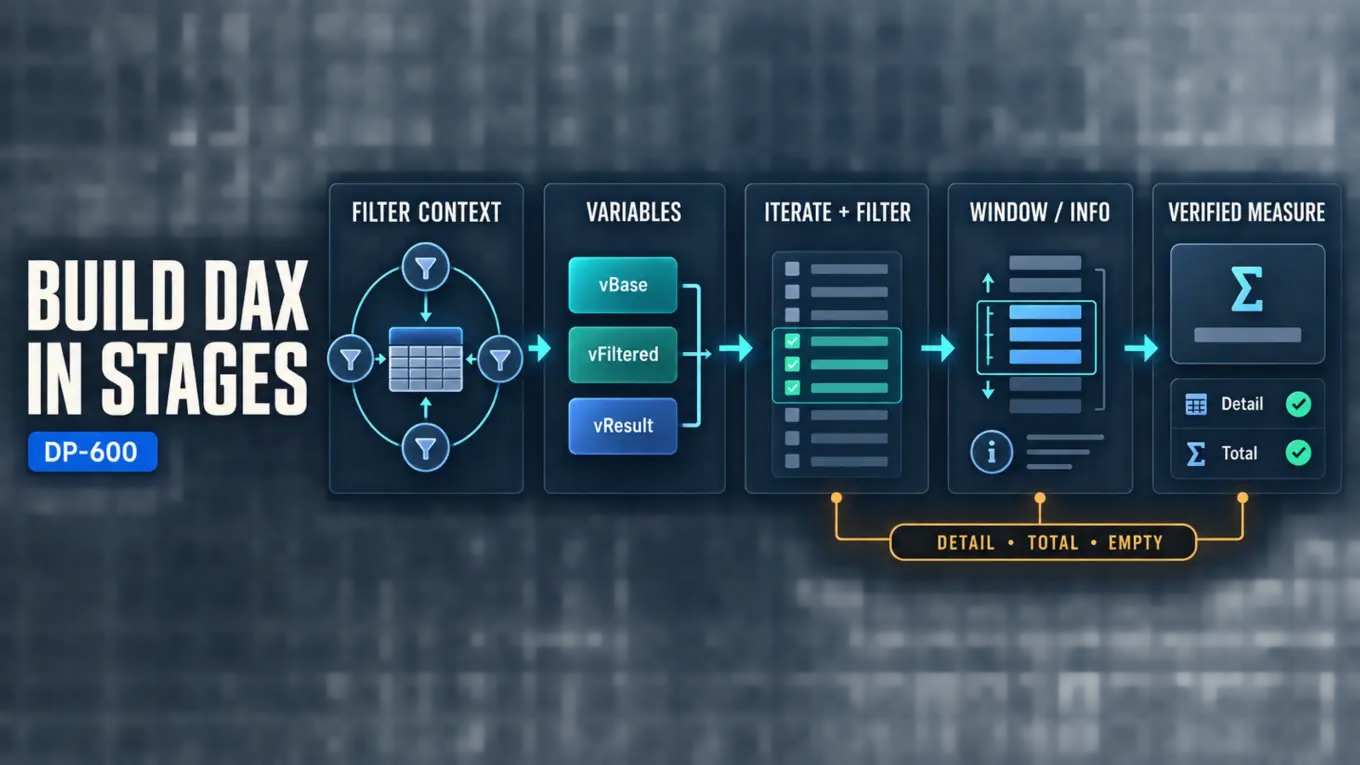
Build advanced Data Analysis Expressions (DAX) measures in stages: establish the required filter context, store meaningful intermediate results in variables, use iterators only when an expression must be evaluated row by row, shape table filters deliberately, and apply window or information functions when their semantics match the analytical question. This structure makes a complex measure easier to verify because every step has one responsibility.
The goal is not to place more functions in one expression. Enterprise DAX is successful when it produces the correct result across totals, subtotals, slicers, relationship paths, and unusual selections while remaining understandable to the next model owner. Start from a sound star schema, define the business grain, and treat every context transition or filter change as a design decision.
Begin with Grain and Filter Context
A measure is evaluated in a filter context. Report filters, visual axes, slicers, relationships, and expressions inside the measure can all contribute to that context. Before writing DAX, state the business question in terms of grain and comparison:
- What event or balance does each fact row represent?
- Which dimensions should filter the result?
- Which filters must be preserved, replaced, or ignored?
- Should a total recompute the business rule at total context, or add visible row results?
- What should happen when the current selection is empty, ambiguous, or outside the comparison period?
If those answers are unclear, adding an iterator or filter function usually hides the modeling problem. Review DP-600: Designing Power BI Semantic Models and Relationships in Microsoft Fabric before compensating for ambiguous relationships in a measure.
The current DP-600 study guide explicitly includes DAX variables, iterators, table filtering, windowing, and information functions. These are connected skills: variables expose the stages, iterators establish row context, table expressions define which rows participate, and information functions help a measure respond safely to the current evaluation state.
Use Variables to Expose the Calculation Plan
Variables make intermediate values explicit and prevent repeated evaluation of the same expression. Name variables after their business meaning rather than their data type or position.
Margin % = VAR Revenue = [Revenue] VAR Cost = [Cost] VAR Margin = Revenue - Cost RETURN DIVIDE(Margin, Revenue)
This pattern separates retrieval of trusted base measures from the final business calculation. It also gives reviewers identifiable checkpoints: verify Revenue, verify Cost, verify Margin, then verify the division and blank behavior.
Variables are immutable within one evaluation of the expression. They store the result calculated where they are defined; they do not behave like macros that are re-evaluated under every later filter change. That distinction matters when a variable is defined before a context-changing expression.
Use variables to:
- Name business stages.
- Reuse an expensive or verbose expression.
- Preserve a value from the current context for comparison.
- Make branch conditions and fallback behavior readable.
- Isolate a table expression that an iterator will consume.
Do not split a one-line measure into many trivial variables merely to appear structured. Each variable should clarify a calculation boundary.
Use Iterators When the Expression Is Row-Dependent
Iterator functions evaluate an expression for each row of a table and then aggregate the results. They are necessary when the required value is not stored as a directly aggregatable column. Revenue calculated as quantity multiplied by unit price is a common example:
Extended Revenue = SUMX( Sales, Sales[Quantity] * Sales[Net Unit Price] )
The expression needs values from each Sales row, so a row-by-row evaluation is appropriate. By contrast, if a validated Revenue column already exists at the correct grain, SUM(Sales[Revenue]) is simpler and often easier for the engine to optimize.
Before using an iterator, ask:
- Is the expression genuinely row-dependent?
- Can the input table be smaller or more selective?
- Does the iterator run over a fact table, a grouped table, or an unnecessary expanded table?
- What result should appear at totals?
A frequent mistake is to assume the total should equal the sum of values shown in a visual. A DAX measure normally recomputes in the total filter context. If the business definition requires adding group-level results, make that grouping and iteration explicit rather than treating the default total as an error.
Shape Table Filters Deliberately
Table expressions determine which rows an iterator or context-changing calculation sees. The safest pattern is to begin with the smallest table that expresses the requirement and preserve existing filters unless the business rule explicitly replaces them.
High Value Revenue = CALCULATE( [Revenue], KEEPFILTERS(Sales[Net Revenue] >= 1000) )
This example illustrates intent: retain the current report context and add a qualifying condition. A more complex rule may need FILTER to evaluate an expression over a table, but that flexibility has a cost. Avoid using a broad table filter when a direct Boolean filter over one column expresses the same requirement.
The official Power BI guidance includes recommendations for filter arguments, variables, relationships, and model design. Apply those recommendations together. A technically valid filter can still be conceptually wrong if it bypasses the intended dimension or relies on bidirectional propagation that the model does not control clearly.
Preserve, remove, or replace filters explicitly
Three business questions often require different behavior:
- “Revenue for selected products” should preserve the product filter.
- “Product share of all products” should preserve the surrounding date and customer context while removing or replacing the relevant product filter.
- “Revenue for a fixed comparison segment” should apply a deliberate segment filter and document how it interacts with user selections.
Do not clear an entire table when only one column filter must change. Broad filter removal can silently discard useful context and create measures that behave unexpectedly when new dimensions are added to a report.
Use Window Functions for Ordered Analytical Sets
DAX window functions are appropriate when the analytical question is defined over an ordered set: ranking, moving windows, previous or next members, or calculations over a range of positions. The WINDOW function, for example, returns rows within an interval defined by absolute or relative boundaries and can apply ordering and partitioning. Correctness depends on a deterministic relation and order.
Before implementing a window calculation, define:
- The partition that creates independent groups.
- The ordering expression.
- A stable tie-breaking rule when the primary order is not unique.
- Whether positions are absolute or relative to the current row.
- Whether the calculation should respect the visible selection or a broader set.
A rolling result without a complete date dimension or deterministic sort key can produce a plausible but unstable answer. Windowing is not a replacement for time-intelligence model design. Confirm that the date grain, sort order, and missing-period behavior match the business definition.
Prefer a window function when the rule is naturally positional. Prefer a simpler aggregation when the rule only requires filtering a date range. The more general function is not automatically the clearer one.
Use Information Functions to Make Context Assumptions Visible
DAX information functions let a measure test properties such as selection count, filter state, hierarchy scope, blanks, or value type. They are useful for guarding against ambiguous selections, determining whether a field is at a particular level, or choosing a result when a value is blank.
Use them to implement a documented semantic rule, not to conceal inconsistent data. Examples include:
- Return a value only when one unit or scenario is selected.
- Change a calculation at a leaf level versus an aggregate level.
- Distinguish a blank business result from a zero.
- Prevent an invalid comparison when a required reference value is absent.
Every guard needs an intentional output. Returning blank can be correct when no meaningful value exists, but it should not hide an upstream key or relationship problem. If a measure contains several defensive branches, investigate whether the model or data-preparation layer owns some of those conditions.
Compose a Complex Measure in Reviewable Stages
Consider a requirement for average order value among high-value customers within the current report selection. A reviewable design has four stages:
- Define the customer set under the current context.
- Calculate revenue per customer.
- Filter to customers meeting the documented threshold.
- Divide the selected revenue by the appropriate order count, with explicit blank and zero behavior.
Each stage can be held in a variable. The customer-level calculation may use an iterator over a deliberately scoped customer table. The threshold is a table-filter decision. Information functions can guard a scenario that requires one currency or business unit. If the requirement later becomes a rolling customer window, add the ordered-set logic as a separate, testable stage.
This decomposition also supports validation. Test a single customer, a group, an empty period, a total, and a selection that crosses the threshold. Compare intermediate variables with simpler diagnostic measures during development, then remove diagnostics that should not become public model objects.
Test Correctness Before Tuning
Create a small validation matrix for every material measure:
| Test context | What it reveals |
|---|---|
| One fact or one entity | Basic arithmetic and row-grain assumptions |
| Multiple entities | Iterator and aggregation behavior |
| Subtotal and grand total | Recalculation versus visible-row addition |
| Empty selection or missing period | Blank and fallback behavior |
| Multiple selections | Ambiguity handling and filter preservation |
| Alternate relationship path | Unexpected propagation or double counting |
Only tune a measure after its semantics are correct. Simplifying filter arguments, reducing iterator input, removing repeated expressions, or shifting stable row-level work upstream can improve performance. Measure the effect rather than judging by expression length. Continue with DP-600: Optimizing and Troubleshooting Enterprise-Scale Power BI Semantic Models for the broader diagnostic workflow.
Common DAX Design Mistakes
Starting with a function instead of a business rule
A memorized iterator or window pattern can return a result without matching the required grain. Write the context and total behavior first.
Repeating expressions instead of naming them
Repeated calculations make reviews harder and can create inconsistent edits. Use a variable when it represents a real intermediate result.
Filtering more data than necessary
Broad table filters can add work and remove context unintentionally. Use the narrowest filter that expresses the rule.
Correcting model problems in measures
Complex filter manipulation often signals ambiguous relationships or an unprepared fact table. Repair the model boundary before multiplying exceptions.
Treating blank as zero automatically
Blank can mean not applicable, missing context, or no data. Preserve that distinction unless the business definition explicitly requires zero.
Conclusion
Maintainable advanced DAX begins with grain and filter context, then uses variables to expose stages, iterators for genuine row-dependent logic, table filters for deliberate context changes, window functions for ordered sets, and information functions for explicit context rules. The resulting measure should be explainable as a business procedure and testable across detail, subtotal, total, empty, and ambiguous contexts.
After the calculation logic is stable, use DP-600: Calculation Groups, Dynamic Format Strings, and Field Parameters in Power BI to reduce repetition and add governed interaction without mixing those presentation responsibilities into every measure.
Authoritative Sources
- Study guide for Exam DP-600
- Power BI guidance documentation
- DAX function reference
- WINDOW function (DAX)
- Information functions (DAX)