
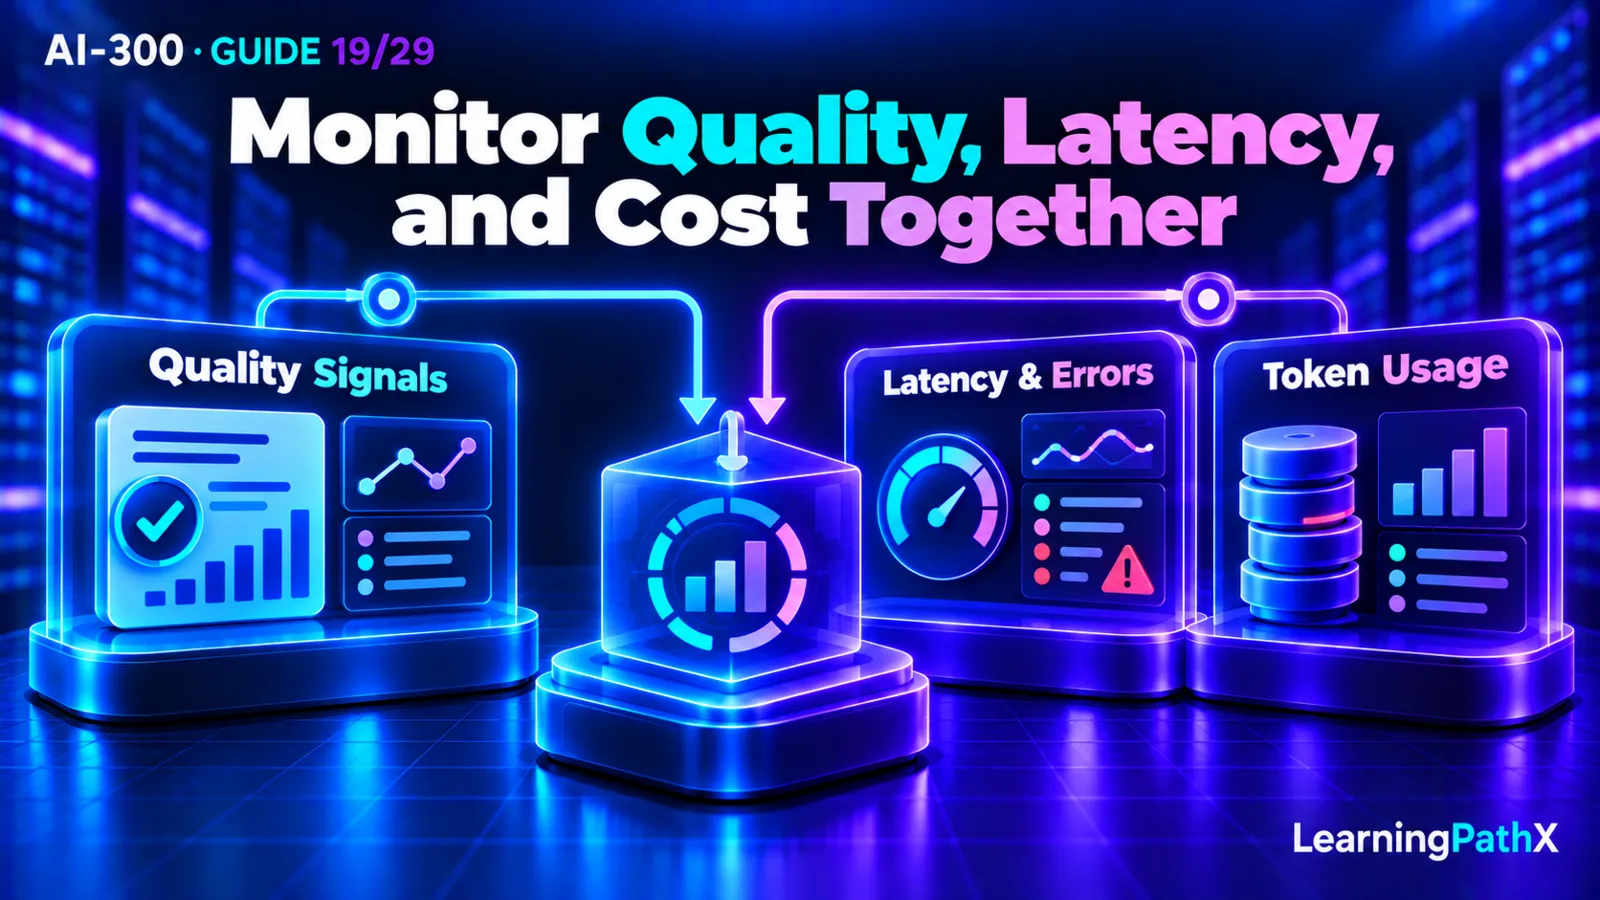
Organize production monitoring around three connected views: sampled quality and safety evidence, operational performance, and cost drivers. Use common application and deployment identifiers to relate those views, attach an owner and investigation action to each alert, and retain enough protected diagnostic evidence to explain a change. In Microsoft Foundry, evaluation, monitoring and tracing work together; Application Insights and OpenTelemetry provide the operational context that helps teams move from a dashboard signal to a focused investigation.
Keep the evidence's limits visible. Continuous evaluation samples production traffic; it does not certify every response. Token counts explain part of resource demand and spending behavior; they are not an invoice. A useful architecture therefore records sampling coverage, error and latency denominators, workload/version context and the billing basis behind any cost estimate. This guide follows current Microsoft Foundry documentation verified on October 15, 2026 and connects measurements to actions without claiming that monitoring automatically optimizes an application.
Architecture Overview: Signals, Context and Decisions
Microsoft describes three observability capabilities: evaluators assess responses, monitoring tracks production behavior, and tracing captures execution across model calls, tools and dependencies. Foundry integrates monitoring and tracing with Azure Monitor Application Insights; its tracing uses OpenTelemetry standards.
Use those capabilities as a connected evidence flow. Operational measurements reveal whether users receive a working, timely service. Sampled evaluators reveal whether observed outputs meet selected quality or safety criteria. Diagnostic traces help an investigator examine the requests behind a regression. Billing records and workload measurements then support a separate cost assessment.
As an architecture recommendation, define the join context before building dashboards. Record the relevant application revision, model deployment/version, prompt/configuration revision, workload category and time window where available. An apparent regression is hard to interpret if several versions are mixed without distinction. Avoid sensitive content or unbounded identifiers in aggregate labels; preserve permitted case-level context in appropriately controlled diagnostic records.
Core Components and Their Responsibilities
Sampled quality and safety evidence
Foundry supports continuous evaluation of production traffic at a sampled rate, alongside scheduled evaluation on test datasets and adversarial testing. These methods answer different questions. Live samples expose real traffic behavior; a stable test set supports comparisons over known cases; targeted adversarial tests probe particular weaknesses. None alone establishes complete quality assurance.
The evaluator reference separates quality concepts such as relevance and groundedness from risk and safety checks. Preserve the selected evaluator's identity and scope with its results. Where an evaluator is marked preview, retain that qualification rather than treating every evaluator as a production guarantee. Evaluator choice itself is covered in AI-300: Choosing Quality, Safety, and Custom Evaluation Gates.
A recommended quality dashboard should show the number of successfully evaluated cases, the relevant time window and the sampled population, not just an average score. Keep evaluator execution errors and missing inputs visible separately from low model scores. No results can mean missing evidence, not good quality.
For a low-volume language or a rare high-risk task, an apparently stable overall sample may provide little information. Review coverage by useful workload groups and complement sampling with targeted tests. If the sampling rate or evaluated traffic mix changes, record that context before comparing periods. A score distribution may move because the observed cases changed rather than because the model did.
Performance, errors and throughput
Foundry's observability view includes latency, error rates, operational measurements and token consumption. Build the application-facing view around the user operation as well as its model dependency. A successful model call does not establish that retrieval, tools or final response delivery succeeded.
Recommended measurements include request volume, successful completions per interval, error and throttling rates, and response-time distributions. State each denominator: errors per attempted request and successful completions per minute describe different aspects of service behavior. Throughput without a success measure can look healthy while failures consume capacity.
Inspect distributions instead of relying only on average response time. For example, a 95th-percentile response time describes the upper portion of observed request durations and can expose a slow tail hidden by a stable median. Define the measurement boundary and whether failures/timeouts are included. When relevant, distinguish time to first token from completion time; fast initial output does not imply a short complete response.
Resource measurements should match the deployment path. Use the capacity or utilization signals actually exposed for that path, and record their scope. Do not assume every model service exposes an underlying GPU utilization counter to the application team. The operational question is whether the available resources and dependencies support the observed workload.
Token and resource cost drivers
Recommended cost-driver views separate input tokens, output tokens, calls per completed user operation and repeated or failed work. The same user-request count can create different demand if a new prompt sends more context or an agent makes more model/tool calls. Compare both totals and normalized measures so traffic growth is not confused with increased work per operation.
Token reduction is not automatically a cost reduction of the same proportion. The applicable model, billing arrangement, usage categories and other service charges determine the financial result. Keep a token-based projection labeled as an estimate and reconcile it with current billing/cost records. Do not present raw token counts as currency or treat a model-only estimate as the application's total invoice.
Foundry documents consumption billing for observability capabilities such as risk/safety evaluation and playground evaluation. Monitoring design therefore needs a budget for observation and assessment as well as inference. Choose sampling and retention deliberately; an uncontrolled diagnostic expansion can add work without producing a useful decision.
How the Components Work Together
Use a shared time window and compatible workload groups to inspect quality, performance and demand together. A latency increase alongside longer outputs suggests a different investigation from a latency increase with unchanged token shape and rising dependency failures. Correlation narrows a hypothesis; it does not establish the cause.
The following table is a recommended operating design, not a set of automatic Foundry remediation rules:
| Observed signal | Investigation owner and first question | Candidate action to validate |
|---|---|---|
| Input tokens per completed operation rise | Application/retrieval owner: did context size, history or call count change? | Remove redundant context or revise retrieval bounds, then re-evaluate answer support |
| Output tokens and completion time rise | Application owner: did verbosity or repeated generation increase? | Test clearer output requirements or appropriate response limits without truncating necessary answers |
| Sampled groundedness declines | Quality/retrieval owner: are inputs, evidence and evaluator coverage comparable? | Test a retrieval or prompt correction against fixed cases and sampled failures |
| Errors or throttling rise at peak load | Service owner: is the request mix, retry behavior or capacity condition different? | Test bounded retries, workload shaping or a capacity change under representative load |
| Cost per completed operation rises | Application and cost owner: did usage, price/billing coverage or repeated work change? | Compare eligible serving/configuration choices using measured workload and actual cost records |
| Evaluation results disappear | Observability owner: did capture, mappings, evaluator execution or sample coverage fail? | Restore the measurement path before interpreting the absence as improved quality |
Every candidate action needs a quality and operational check. Shortening retrieved context can reduce input demand while removing the fact an answer needs. Tightening an output limit can shorten responses while breaking required structure. A capacity change cannot repair an unrelated quality failure. Keep the hypothesis and acceptance evidence together.
Design Considerations: Alerts That Lead to Useful Work
Define ownership and the investigation handoff
For each recommended alert, record its signal, scope, comparison window, threshold rationale, owner and first action. Distinguish immediate service or safety escalation from a trend that needs capacity or optimization review. Do not choose a universal numeric threshold unrelated to the application's workload and consequences.
Include supporting context in the handoff: affected deployment/configuration, request volume, baseline period, sample count, change history and permitted diagnostic identifiers. Define how missing telemetry is detected. A dashboard that silently stops receiving data cannot establish continued service health.
Avoid prescribing a detailed trace-debugging procedure inside the monitoring architecture. An investigator should be able to reach the relevant evidence, but the step-by-step examination of a slow or incorrect request belongs in AI-300: Tracing Slow or Incorrect Generative AI Responses.
Turn measured cost signals into a bounded optimization test
Consider an original proposed support-assistant scenario. After a retrieval configuration change, input tokens per completed operation rise and the slow-response tail grows. The overall sampled quality score appears stable. These observations would justify investigation; they do not prove that context reduction is safe or that the bill increased by the same proportion.
A recommended response would be:
- Check that both periods cover comparable task groups, versions and measurement boundaries. Inspect sample coverage before calling quality unchanged.
- Compare retrieved context size, call counts and repeated work to identify a concrete source of additional demand.
- Form a narrow hypothesis, such as redundant passages increasing context without improving evidence coverage.
- Test a candidate context-selection change on a fixed representative set, including cases that need longer evidence and the observed production failure patterns.
- Compare quality/safety evidence, response-time distributions and token/call demand under equivalent conditions.
- Project the financial effect using the applicable billing basis, then reconcile with actual cost records after any controlled change.
- Accept, revise or reject the candidate based on the combined result and continue observing the relevant groups.
This is a proposed process, not an executed benchmark or a promised saving. The monitoring architecture supplies evidence and an owned action; the tested application change produces the result. Retain the decision even when the candidate is rejected so the next investigation does not repeat an unsupported assumption.
Protect diagnostic content and measurement integrity
Decide what request/response content may be collected, who can access it and how long it is needed. Use permitted identifiers and sanitized diagnostic records where possible. More raw content is not inherently better observability if it creates exposure or cannot be reviewed safely.
Check region, network and evaluator availability for the selected current workflow before standardizing collection or assessment. The observability overview points to separate support and limits guidance; it does not justify assuming universal compatibility. Preserve configuration changes to sampling, evaluator versions and instrumentation so a monitoring change is not mistaken for an application improvement.
Common Mistakes
- Treating sampled quality scores as evidence that every response was assessed.
- Hiding evaluator failures or missing data inside a favorable aggregate.
- Comparing time windows with different traffic groups or sampling coverage without qualification.
- Watching average latency while ignoring failed requests and slow-response tails.
- Calling token counts an invoice or claiming savings before checking the billing basis.
- Reducing context or output length without checking quality and required response structure.
- Creating alerts without an owner, investigation question or useful diagnostic context.
- Assuming the platform automatically applies the optimization suggested by a chart.
Certification Relevance
For AI-300, explain how evaluation, production signals and tracing contribute different evidence to an operational decision. Be able to connect a quality regression, latency shift or token increase to a responsible owner and a testable action. Preserve the limits of sampling, measurement boundaries and cost attribution while making the architecture useful for real investigation.
Conclusion
Monitor quality, service behavior and cost drivers together, with consistent context and explicit owners. Keep sampled evidence and financial estimates qualified, investigate the measured change and validate the proposed correction across quality and performance. The result is an observation-to-action process whose decisions can be explained and checked.