
Introduction
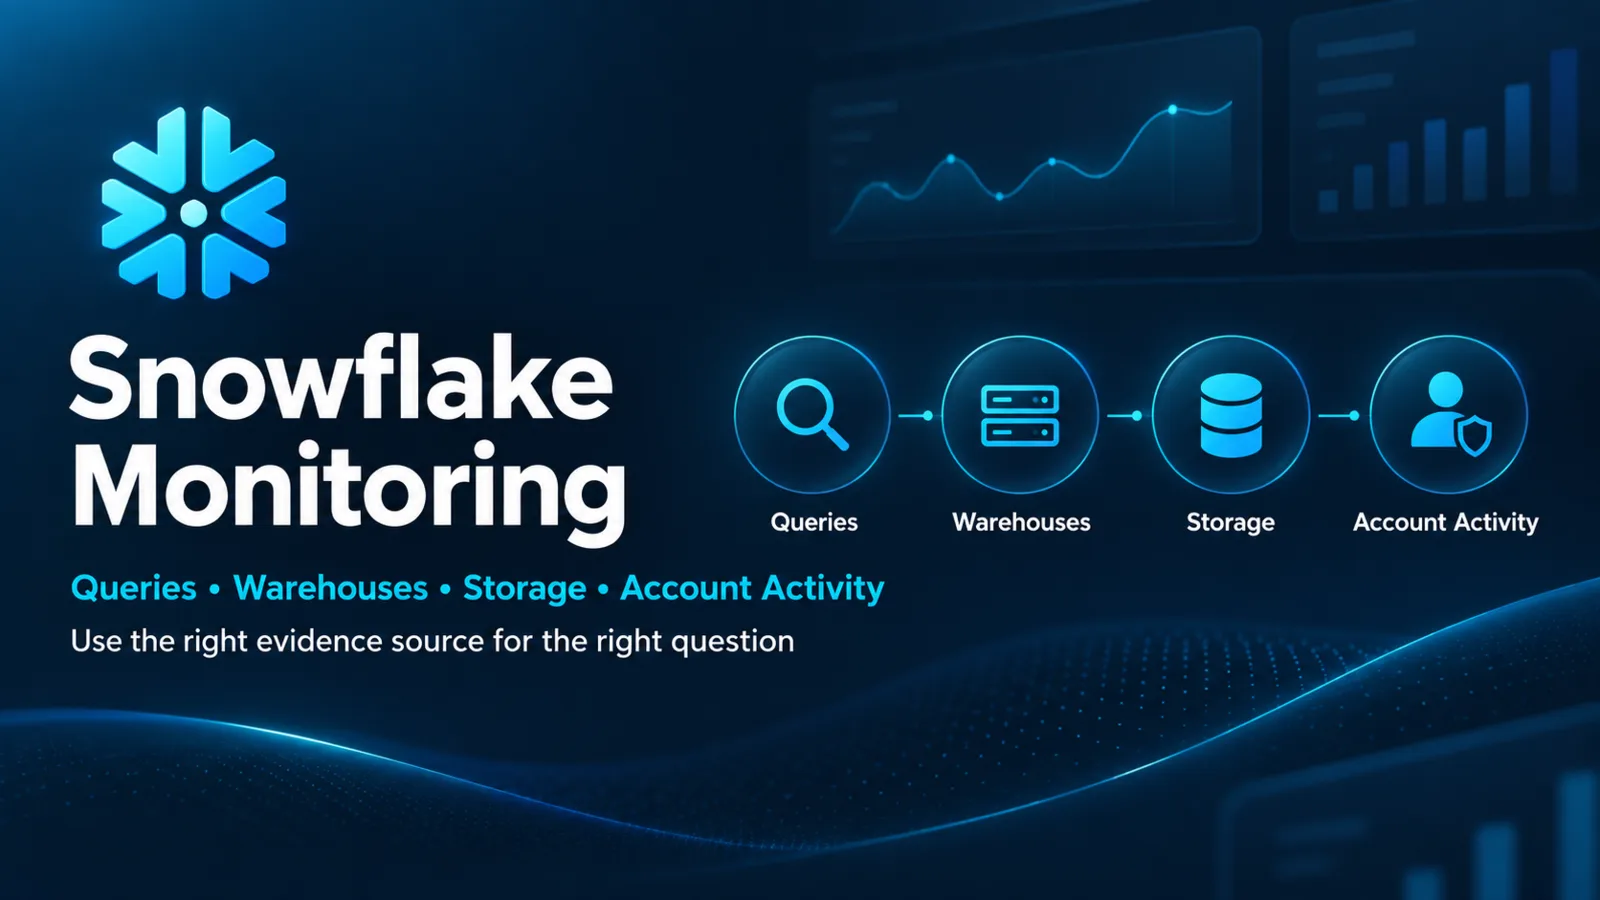
Snowflake monitoring is an evidence-selection problem. Snowsight pages, Information Schema table functions, and views in the shared SNOWFLAKE database expose overlapping but not identical time ranges, latency, scope, and privilege requirements. Effective operations begin by defining the question and then choosing the interface whose evidence can answer it.
Monitoring Questions and Evidence
Common questions include:
- Why did a specific query fail or run slowly?
- Is a warehouse queued, idle, or consuming more credits than expected?
- How is storage changing over time?
- Which user, role, or application performed an action?
- Did a task, pipe, or load run successfully?
- Is an account-level pattern visible across days or months?
A single dashboard rarely answers all of them. Query-level diagnosis needs a query identifier and detailed profile. Trend analysis needs bounded history views. Security investigation may need access history and login evidence subject to edition and privilege requirements.
Query History and Query Profile
Snowsight Query History can filter by status, user, warehouse, statement type, duration, session, query tag, and other documented fields. It exposes query details and, when available, Query Profile. The current documentation states that the Query History page covers the previous 14 days; some user details have shorter retention behavior.
Query Profile represents the execution plan as operators and row flows. It can show where time was spent across processing, local or remote disk input/output, network communication, synchronization, and initialization. It also helps identify scanning, filtering, joins, spill, and expensive operators.
A failed parse has no completed execution plan, and old or privilege-restricted queries may not expose profile details. Absence of a profile is therefore evidence about the query state or visibility, not proof that monitoring is broken.
Information Schema and ACCOUNT_USAGE
Information Schema table functions are useful for recent, object-scoped, or parameterized operational queries. ACCOUNT_USAGE views in the shared SNOWFLAKE database support longer-term account history and analysis, but each view has documented latency, retention, columns, and required database roles.
Do not combine values from interfaces without checking their time zone, update latency, and filtering semantics. Bound time ranges and select only required columns, especially for high-volume history views.
A lab query can identify recent slow statements:
SELECT
query_id,
user_name,
warehouse_name,
total_elapsed_time,
bytes_scanned,
error_code
FROM snowflake.account_usage.query_history
WHERE start_time >= DATEADD(hour, -24, CURRENT_TIMESTAMP())
ORDER BY total_elapsed_time DESC
LIMIT 50;
Verify current column definitions, view latency, and privileges before operational use. Elapsed time is not enough to identify cause; open the relevant profile and inspect queueing or operator evidence.
Warehouse and Cost Monitoring
Warehouse monitoring should separate:
- Execution time from provisioning and queueing time.
- Size from active cluster count.
- Busy runtime from idle runtime.
- Query-level cost attribution from warehouse-level consumption.
- User-managed warehouse consumption from serverless feature consumption.
Use query tags, workload-specific warehouses, and consistent ownership metadata to improve attribution. A resource monitor can notify or act on supported warehouse credit thresholds, but it does not explain which query pattern created the consumption.
Storage and Account Activity
Storage evidence includes active table bytes, Time Travel retention, Fail-safe storage, staged files, and feature-specific storage. A sudden increase should be tied to object history and lifecycle events before cleanup.
Account activity may involve login history, access history, grants, policy changes, tasks, pipes, or data sharing. Availability and retention can depend on edition and database roles. Treat privileged activity data as sensitive and grant monitoring roles only the required views.
A Monitoring Workflow
- State the exact symptom, object, account, and time window.
- Capture stable identifiers such as query ID, task name, pipe name, or warehouse.
- Select the lowest-latency source that covers the event.
- Check source latency, retention, time zone, and privileges.
- Correlate across layers only after normalizing timestamps and identifiers.
- Record evidence before changing the system.
- Validate the outcome using the same indicator after remediation.
Common Mistakes
- Treating a delayed history view as real-time status.
- Scanning an unbounded history view.
- Diagnosing a query from elapsed time alone.
- Ignoring queueing when evaluating warehouse performance.
- Comparing timestamps from different zones without normalization.
- Assuming every role can see every query's text and profile.
- Deleting data after a storage increase without identifying retention or clone dependencies.
Certification Relevance
COF-C03 includes monitoring and optimizing performance. Monitoring comes first: candidates should be able to select an evidence source, understand its scope, and avoid making a configuration change from an incomplete metric.
Authoritative Sources
Conclusion
Snowflake monitoring is reliable when the question, time window, identifier, and evidence source align. Use Query Profile for execution mechanics, bounded history for trends, and explicit latency and privilege checks before drawing conclusions.