
Introduction
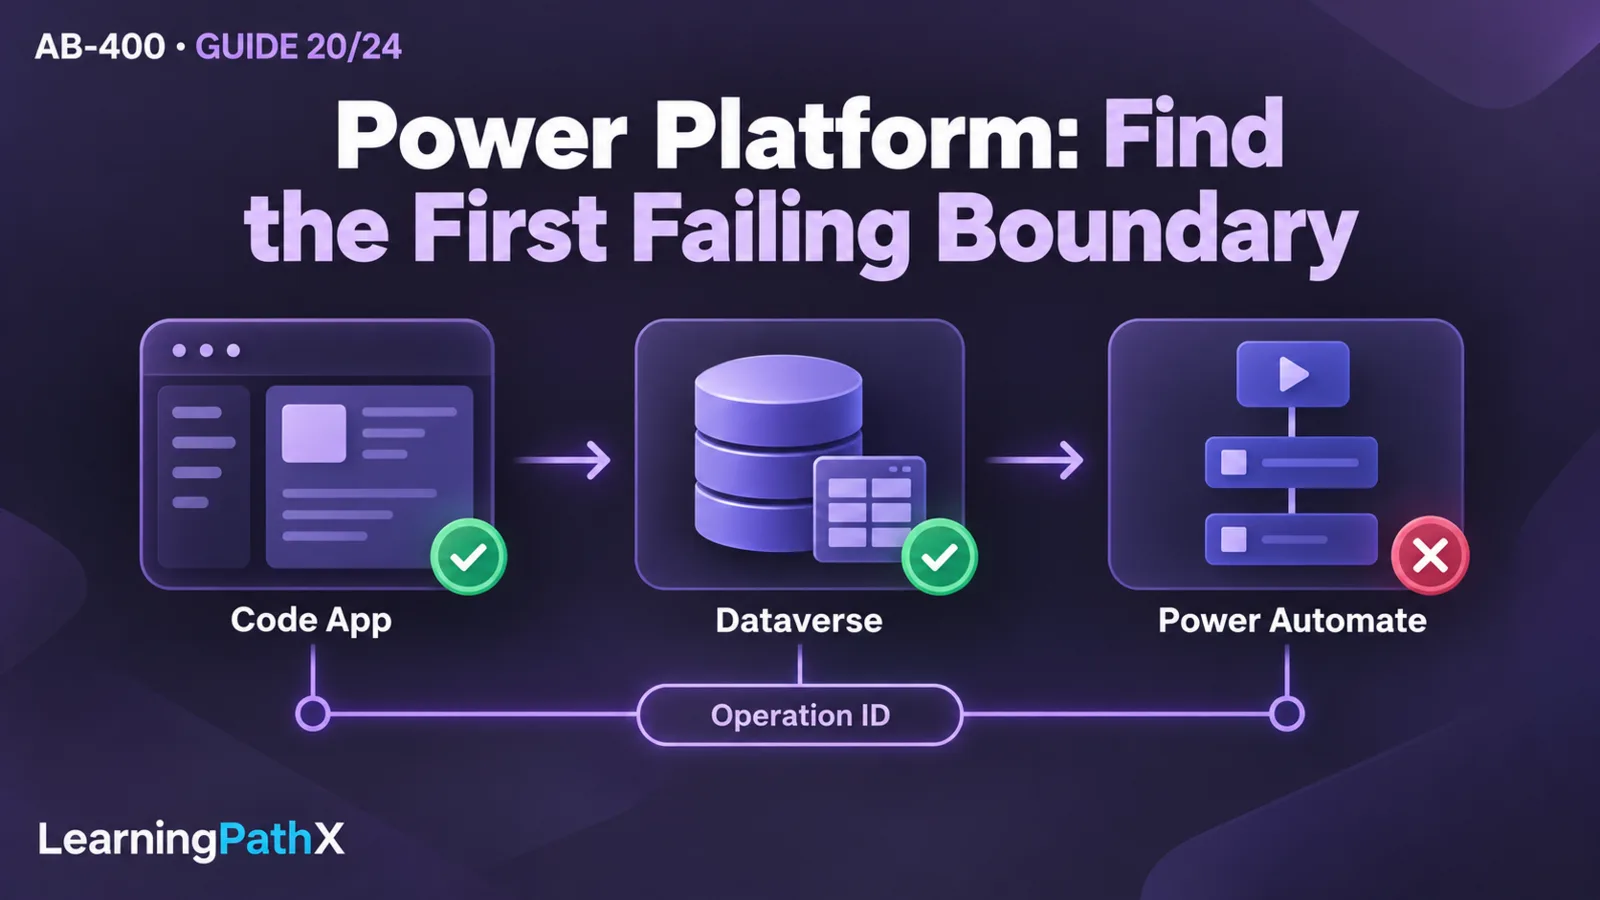
Detect a failed business operation by monitoring both component health and the business outcome, then isolate it by finding the first boundary where observed evidence differs from the expected contract. For an operation crossing a Power Apps code app, Microsoft Dataverse and Power Automate, correlate the submission, server execution and automation run using an explicit application operation identifier plus each component's native diagnostic identifiers. A successful app request proves only the work covered by that response; it does not prove that later automation completed.
Tracing Failures Across Power Platform Extensions therefore starts before an incident: define the expected transitions, collect evidence at their boundaries and test the alert path. This guide develops that method using an illustrative expense-submission operation. The procedures and acceptance results below are recommendations and expectations, not claims of execution in a tenant. The series retains its October 15, 2026 scope baseline; the cited product documentation was rechecked October 16, 2026.
Troubleshooting Methodology: Define the Evidence Contract
Suppose a code app submits an expense request through a Dataverse custom API. Server logic validates the request and writes its initial state. A cloud flow subsequently performs routing and records a terminal business status. For this example, the application contract distinguishes Submitted, Routing and Completed from Failed; these are application states, not built-in Power Platform monitoring statuses.
Write down which component owns each transition and what proves it. The most useful incident question becomes “What is the last confirmed transition?” rather than “Which dashboard is red?”
| Boundary | Evidence to retain | What it establishes |
|---|---|---|
| App opens | Platform Monitor evidence and browser console/network observations | Whether execution reached the application's telemetry initialization |
| User submits | Application operation ID, UTC time, environment, release and intended operation | Which attempt the user means |
| Dataverse responds | Response outcome, available request identifiers and sanitized error details | Whether the synchronous request reported success or failure |
| Plug-in executes | Message, stage, execution identity and a small set of trace milestones | Which server boundary was reached and where custom logic failed |
| Flow starts and finishes | Application operation ID, flow/run identity, failed action and business-state transition | Whether downstream work began and reached its agreed outcome |
Use a random, nonsecret application operation ID. Pass it as a defined field in the custom API contract or stored request record, and explicitly map it into flow inputs or the data read by the flow. Do not assume an arbitrary HTTP header travels through every connector, or that an Application Insights operation ID automatically becomes a Dataverse or flow correlation ID. At each handoff, record the association between the application ID and the native ID that the component actually exposes.
An application operation and an execution attempt are different concepts. Retrying the same expense submission should retain the business operation identity while identifying the new attempt. Otherwise, three transient failures followed by success can look like four independent expenses. Correlation assists investigation; it does not itself prevent duplicate side effects. Confirm the operation's replay rules before resubmitting it.
Detection: Choose Signals and Alert Cadence
Power Platform Monitor alerts for aggregate health
Microsoft documents Power Platform Monitor metrics as 24-hour aggregates, with alert evaluation every 24 hours after new aggregates are produced and an on-demand evaluation when a rule is created. Custom alerts require a tenant or environment administrator, a Managed Environment and the new Power Platform admin center. In Monitor, create an alert rule, select the product/type and environment or resource scope, then choose an available metric, operator, threshold, severity and notification setting.
Select Email when notification is required; None requires checking Monitor. Predefined alerts do not send notifications. The resource-scoped Data review period option is currently preview and available only for code apps; its one-hour option enables hourly metric aggregation. Do not generalize that preview to all resources or promise real-time alert delivery.
For the expense application, use these alerts to notice a deterioration across users or runs. Record the selected metric and aggregation in the operating procedure. An aggregate health rule cannot tell the support engineer which individual expense failed; it starts an investigation that needs the evidence contract above.
Azure Monitor log search alerts for instrumented events
Azure Monitor log search rules separately define resource scope, query, measurement, window, threshold and evaluation frequency, with action groups controlling notification actions. Creation requires read access to the target, write access to the rule's resource group and read access to an associated action group. Preview the query against ingested data before enabling it. Choose stable dimensions such as environment or operation type; a new operation ID for every submission creates excessive alert instances.
A suggested application signal is a custom terminal-failure event emitted by a trusted observer of the final business state. If only the browser emits it, closing the app can hide a later flow failure. Arrange and verify the server-side reporting path separately; forwarding browser metrics does not automatically export plug-in traces or flow runs to Application Insights.
For a development exercise, define an event named ExpenseOperationFailed with sanitized environment, release, operation ID and failing-boundary properties. In an Application Insights Logs context exposing customEvents, this illustrative Kusto Query Language query returns failure events for inspection:
customEvents
| where timestamp > ago(15m)
| where name == "ExpenseOperationFailed"
| project timestamp, customDimensions
The event name is an example contract you must implement. Check the actual ingestion schema before adopting the query. A proposed development rule could count returned rows and trigger when the count exceeds zero, using a five-minute evaluation frequency and a fifteen-minute window. These are chosen test settings, not Microsoft defaults or delivery guarantees. Overlapping windows can observe the same event repeatedly; choose the rule's state and notification behavior deliberately. Measure the actual delay from event creation through ingestion, evaluation and receipt.
Neither a failure-event rule nor a successful query detects an operation that disappears without emitting a terminal event. For the example, add a separate reconciliation check for Submitted or Routing records older than the business's agreed completion deadline. Compare that result with current runs before declaring failure: late and failed are different conditions.
Common Issues and Their Distinguishing Evidence
No Application Insights evidence: startup failure or telemetry failure
The documented code-app integration captures telemetry after the app loads. Startup failures appear in Monitor rather than that application telemetry. When a user sees a blank app and the telemetry query returns nothing, inspect Monitor and browser evidence before investigating Dataverse. Establish whether application code executed and whether the business request was ever sent.
If the app works but telemetry is absent, examine the telemetry transport separately. The documented client logger forwards session and network metrics through the logging implementation; confirm it is initialized and sends data to the intended resource. Content Security Policy (CSP) can block the telemetry connection. Code-app CSP is environment-wide, and reporting and enforcement are separate settings: a reported violation alone does not establish that enforcement blocked the request. Match the directive, resource and enforcement state before changing policy.
Do not disable CSP broadly to make a dashboard populate. Have the environment administrator evaluate the minimum required sources, account for other apps in the environment and retest the business request and telemetry independently. Deployment and full CSP configuration belong in AB-400: Deploying and Troubleshooting Power Apps Code Apps.
Request rejected: identity, authorization or business validation
First preserve the actual service error, operation, environment and effective execution identity. Then distinguish a request that failed to authenticate from one that authenticated but lacks permission, and both from a valid business rejection. An HTTP status is a clue; the service error and execution context provide the diagnosis. “Works for an administrator” narrows the investigation but does not justify giving the user administrator access.
Compare the app caller, the identity used by the plug-in's data operation and the flow connection identity. They can be different. Check the minimum permission and row-access requirement for the failed operation at that boundary. A user may submit successfully while the downstream connection cannot update the routing result. Test the fix with the intended identity and the same relevant record ownership/access conditions.
Missing row after a server error: rollback
Dataverse tracing uses ITracingService, with Off, Exceptions and All logging modes. Trace records can survive a database transaction rollback even though the custom code's table changes are undone. Use that trace to distinguish “the plug-in never ran” from “the plug-in ran and its transactional changes rolled back.” Reading a newly written business row cannot prove execution when that write was rolled back.
Capture concise entry, validation and exit/failure milestones instead of whole payloads. Include stage and transaction context in the investigation; an entry trace is not proof of commit. Trace access needs appropriate privileges, and sensitive trace columns, including MessageBlock, are restricted to System Administrator. A null message for a restricted reader does not prove that no trace was written. Ask an authorized operator for a sanitized excerpt rather than expanding privileges casually.
Dataverse succeeds but routing fails: asynchronous work
Look up the operation's persisted state and associated flow run. Inspect the first failed action and its inputs/outputs as permitted, rather than treating later skipped actions as separate root causes. For an asynchronous plug-in failure, examine its System Job evidence as well. A successful synchronous response and a downstream failure can both be correct observations of the same operation.
For cloud flows, Run after settings select paths for failed, timed-out, skipped or successful actions. A Try/Catch scope pattern can collect results, while workflow() provides run information. Store the relevant run identity with the application operation ID, and use result() evidence to identify a failed action in a scope. If a critical failure remains unresolved, a Terminate action can mark the run Failed. A catch path that merely logs and ends successfully can otherwise mislead an investigation that relies only on overall run status.
In the example, make Failed an explicit business outcome even when the error handler itself completes. Conversely, record a recovered transient error as recovered, so the final-outcome alert does not page someone for every successful retry. Check that the logging action's own failure cannot erase all access to the original error.
Intermittent failures under load: throttling
A Dataverse Web API service-protection response uses HTTP 429 and supplies Retry-After. Preserve that value, attempt times and concurrency evidence. Compare failures by effective caller as well as operation type; an apparent random issue can share one busy service identity. Respect the returned delay and reduce demanding concurrency instead of immediately replaying the whole workflow. Service-protection limits and license/request allocations are different concepts.
For diagnosis, compare one failed attempt with a successful low-load attempt using equivalent inputs. Keep the business operation ID stable through a permitted retry, then verify the final side effect once. Increasing every timeout or adding retries at every layer can delay detection and multiply submissions without correcting the original pressure. AB-400: Reliable Dataverse Bulk and Background Operations develops the execution-design choices.
Troubleshooting Workflow: Follow One Operation
Use this sequence for the expense-submission example. Preserve evidence before changing configuration or retrying an operation with possible side effects.
- Record the complaint precisely: expense operation ID if available, UTC interval, environment, app release, user-visible result and expected terminal outcome. Separate this evidence from the investigator's hypothesis.
- Determine whether the app loaded and sent the intended request. If not, use Monitor and browser startup/CSP evidence. If yes, preserve the response and available native request identifiers.
- Locate the matching server execution using time, operation/message and recorded correlation associations. Inspect the earliest failing milestone and the actual execution identity. If no match exists, check environment, tracing mode, reader access and retention before concluding that the plug-in was not invoked.
- Establish committed state. For a synchronous server failure, use exception and trace evidence to determine whether the transaction rolled back. For a reported success, read the expected record/state with appropriate access rather than inferring completion from a toast notification.
- Follow downstream work using the stored flow/run association. If no run exists, inspect the handoff and trigger selection. If a run exists, inspect its first failure, retries, connection identity and terminal business status.
- State a falsifiable cause: for example, “routing attempted the update under connection X and received a privilege error,” supported by that action's evidence. A dashboard's high error rate describes impact, not cause.
- Apply the narrow fix in development, reproduce with the intended identity and rerun only safe work according to the operation's replay contract. Confirm both the final state and any external side effect before resolving the incident.
Best Practices: Accept the Monitoring Path Before Depending on It
An alert rule saved successfully has not yet passed an operational test. In an isolated environment with synthetic expense data, obtain the required admin and telemetry-resource access, establish expected cost/retention and agree on recipients. Do not deliberately overload a shared production environment to manufacture throttling.
Use the following acceptance matrix as a recommended test record. Expected outcomes must be confirmed in your environment; this guide reports no executed results.
| Controlled test | Expected evidence and acceptance |
|---|---|
| Healthy submission | One agreed final business result, correlation across its actual components and no terminal-failure notification |
| Deterministic validation rejection | Clear app error and matching server evidence; no false claim that asynchronous routing completed |
| Downstream permission failure | Committed request plus failed action/run association; the terminal business status and intended notification identify the failing boundary |
| App cannot initialize | Monitor/browser evidence remains usable despite no Application Insights app event; operators follow the documented fallback |
| Telemetry transport interrupted | Business behavior and telemetry behavior are diagnosed separately; the team recognizes that absent telemetry is not proof of health |
| Failure event and recovery | Azure log query finds the known synthetic event; the selected action reaches the correct recipient; recovery and repeat-notification behavior match the chosen rule settings |
| Aggregate rule threshold crossed | Power Platform Monitor shows the intended resource/metric and evaluation evidence; Email delivery is checked when configured, with the documented aggregate cadence respected |
Include a negative routing test: the test-environment alert must not notify the production escalation list. Record event time, ingestion observation, rule evaluation and notification receipt separately so any delay has an identifiable location. For the aggregate rule, use an appropriate existing test metric/threshold rather than pretending one failed expense instantly changes a daily aggregate enough to trigger it.
Preserve a small sanitized incident bundle: expected transitions, observed sequence, relevant IDs, first failure, fix and acceptance result. Exclude access tokens, credentials and unnecessary financial data. Plug-in traces consume storage and have limited retention, so collect required evidence promptly and turn troubleshooting logging off when finished. Restore temporary roles, thresholds, recipients and policy changes; delete synthetic records only after confirming no pending automation will recreate or act on them. Retain the approved production rules and ownership record.
Certification Relevance
The selected AB-400 scope includes monitoring and alerting design alongside extension troubleshooting. The useful skill is selecting the evidence that can prove a boundary failed, then explaining what the evidence cannot prove. Practice distinguishing aggregate health, request failure, transactional rollback and eventual business completion without turning a successful response into an end-to-end success claim.
Conclusion
A diagnosable Power Platform operation has explicit outcomes, recorded correlation associations and a tested route from signal to operator. Start at the last confirmed transition, find the first supported failure and verify the fix against the business result. Treat observability failures as part of the investigation, and use each alert's actual scope and cadence when deciding how quickly it can help.
Authoritative Sources
- Configure Content Security Policy for code apps
- Set up Azure App Insights for code apps
- Service protection API limits
- Employ robust error handling in cloud flows
- Create alerts for Power Platform resources
- Create or edit Azure Monitor log search alert rules
- Logging and tracing for Dataverse plug-ins
- Understand execution context in Dataverse
- AB-400 study guide