
Introduction
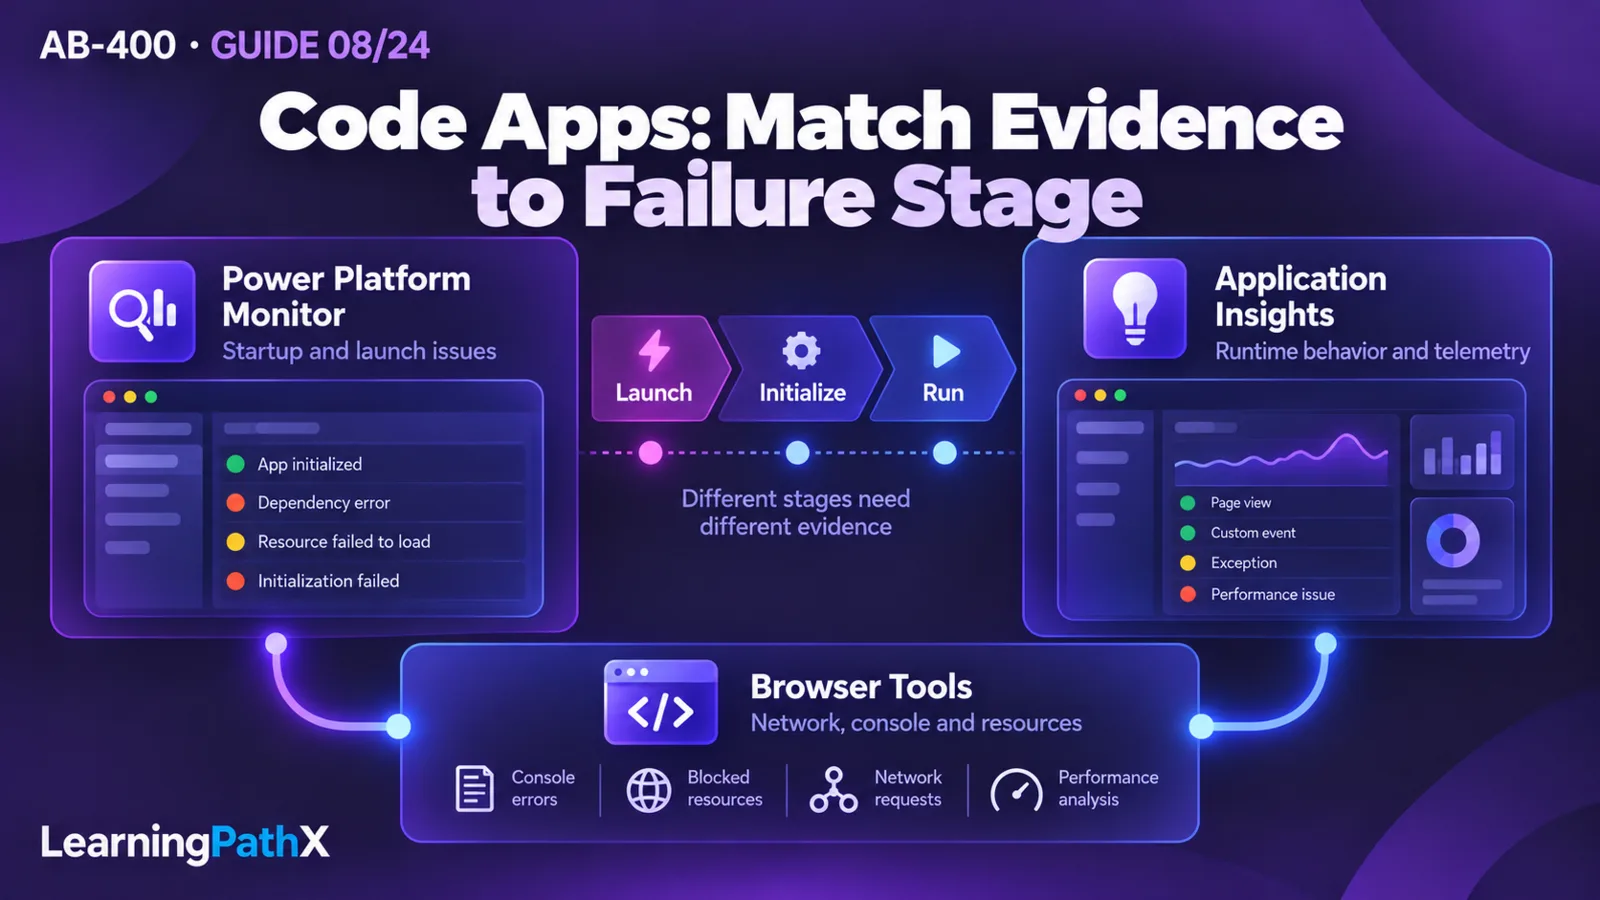
Release a Power Apps code app by building the tested source, publishing it into the intended environment and solution, and validating access as an intended user. For failures, first locate the last successful boundary: deployment, platform launch, browser initialization, data request or rendering. Use Power Platform Monitor for startup evidence, browser tools for blocked resources and execution, and application telemetry for behavior after initialization. Change the component implicated by that evidence, then repeat the same test.
Deploying and Troubleshooting Power Apps Code Apps therefore requires more than a successful upload. A release is usable only when its target configuration, users and browser dependencies agree. This guide assumes an existing working app; it does not rebuild its data operations. Product documentation was checked on October 16, 2026 against the series' October 15 scope baseline. The procedures and illustrative observations below are recommendations and expected results, not claims of tenant execution.
Troubleshooting Methodology: Find the Failing Boundary
Start an incident record with the environment, app identity, release identifier, affected browser/profile, user role, reproduction time and exact action. Record whether the screen never appears, appears without data, or becomes slow after interaction. Preserve the first relevant error before refreshing repeatedly: later messages may be consequences of a missing script or failed initialization.
Use a comparison that changes one variable. Test the same release as the maker and an intended user to investigate access. Test the same user against the previous known-good release in an isolated test environment to investigate a regression. Compare local and hosted runs only after recording that their hosting and browser conditions differ. A local success narrows the investigation; it cannot establish that a hosted dependency or platform policy is correct.
Choose the next test from observable evidence:
| Symptom | Discriminating evidence to collect | Safe next test |
|---|---|---|
| Publish fails or the solution lacks the app | Publishing error, selected environment and solution identifier, actual solution membership | Confirm the destination before another upload; distinguish a nonexistent solution from an invalid identifier |
| Maker launches; intended user cannot | User-specific launch result, app sharing, licensing and policy decisions | Retest with one intended user in the correct tenant/profile; avoid granting broad administrator access |
| Screen is blank | Earliest Console exception, missing/blocked resources in Network, Monitor startup evidence | Reproduce once with the console cleared; inspect the initiating error before changing data queries |
| Screen loads; data does not | Whether a request was sent, its status, target and response error | Compare target configuration and the affected user's connection/permissions using a read-only operation |
| App works; telemetry is absent | Logger initialization and browser evidence of attempted telemetry delivery | Separate a missing event from a blocked or unsuccessful send |
| App loads but freezes or repeats requests | Network request count/timing and browser Performance recording | Reproduce one interaction on a fixed test dataset and compare request activity with main-thread work |
These are diagnostic branches, not mappings from one symptom to a guaranteed cause. A blank screen could be a JavaScript exception or a blocked asset. An HTTP error can originate beyond the browser; its response and correlation details matter more than its number alone.
Common Issues in Code-App Releases
Issue Analysis: Make Deployment Placement Explicit
The current Power Apps CLI (command-line interface) is pa; Microsoft Power Platform CLI pac is a separate tool. With an initialized project and current tooling, the documented build/publish sequence is:
npm run build
pa app push --solution-id <solution-id>
Run this from the approved project root after confirming its environment configuration. Replace the placeholder with the solution's globally unique identifier (GUID), not its display name. These commands publish compiled code; do not run them against production merely to diagnose a user's browser issue.
Microsoft's code-app application lifecycle management (ALM) documentation states that explicit solution targeting validates the GUID and destination before upload. Without a target, first publish uses automatic solution selection; a later publish preserves existing membership. Environments without Dataverse can publish without a solution, but cannot use explicit solution targeting. An existing app can also be added through Solutions, Add existing, App, Code app. Solution membership supports standard export/import movement.
For a predictable release, record the intended solution before publishing and inspect membership afterward. An app that runs in development but is absent from the exported solution is a packaging problem. Repeating a successful upload without checking placement does not resolve it. PA_CLI_SOLUTION_ID is the documented pipeline setting for explicit targeting; keep its configured value in the release record alongside the environment.
Once the app is solution-aware, Power Platform pipelines provide staged deployment and preflight checks for dependencies and configuration. Pipelines transport solutions and deployment configuration, including connection references and environment variables; they do not transport Dataverse table data. Treat test data provisioning and acceptance testing as separate release work. This also avoids diagnosing an empty production table as a failed code-app deployment.
Root Cause Considerations: Launch Access and Target Configuration
The quickstart identifies Power Apps as the place to play, share and inspect a published app. The overview documents an environment enablement setting, supported end-user licensing options, sharing limits and policy enforcement. Confirm these for the destination and affected user rather than assuming the maker's experience proves end-user readiness. End-user access can use Power Apps Premium or another documented option, such as pay-as-you-go; verify the tenant's chosen arrangement before release.
Recommended access acceptance uses a non-maker test identity with the intended privileges. First establish that this identity can launch the app, then test its expected data access. Keep the two results separate. If an administrator's account works, record that as a comparison rather than adopting elevated privileges as the fix. Capture the relevant denial and correct the smallest missing entitlement or configuration through the responsible owner.
For tabular data sources, the dedicated environment-variable documentation supports schema-name references for dataset/table arguments, prefixed with @envvar followed by a colon. The references persist in power.config.json and resolve values in the target environment. During a wrong-data incident, inspect those references and the target values before changing generated service calls. A valid connection to an unintended dataset can return plausible data, so validate the expected target identity as well as request success.
This data-source feature does not establish arbitrary runtime telemetry-setting injection. Keep configuration surfaces distinct in the release checklist: data-source targets, connections and telemetry destination each require their own verification.
Resolution Approach: Diagnose CSP Without Removing Protection
Content Security Policy (CSP) settings apply to all code apps in an environment and require an environment administrator to change. Enforcement and reporting are separate: reporting can send violations to a configured endpoint with enforcement on or off. A report alone therefore does not prove a resource was blocked. Confirm the effective mode and the browser's action for the failing request.
Use the Console to identify the violated directive and resource. script-src governs scripts; connect-src governs connections such as telemetry delivery. Correct the directive implicated by evidence rather than adding the resource everywhere. Custom sources generally append to defaults, replacing a default of 'none'. A blank custom source list can disable a directive. The documented application programming interface (API) helper replaces the entire directive collection when updating it, so retrieve and preserve the current settings before editing.
Recommended change control is to capture the original policy, identify the dependency's purpose and ownership, and approve the narrow required source in an isolated environment. Then test the affected app and other representative apps sharing that environment. Keep enforcement enabled for acceptance. If a report-only evaluation is necessary, agree its scope and restoration with the administrator first; an environment-wide setting has a wider effect than one app's code change.
Do not treat every blocked destination as something to allow. An unexpected analytics library, abandoned asset reference or unapproved service may be the defect. Removing that dependency can be the appropriate correction. Keep the captured original configuration available for recovery and verify the restored effective policy after any failed change.
Select Monitor, Application Insights and Browser Evidence Deliberately
Microsoft's Application Insights setup guide says telemetry begins after successful app load; startup failures belong in Monitor. The guide uses the Application Insights web SDK, then a once-configured setConfig logger whose logMetric forwards platform payloads as events. It documents session and network summaries, including timeToAppInteractive and request duration/status. Granular logs and custom events complement Monitor rather than replace it.
The same guide recommends a Dataverse settings table or environment-aware selection of app constants for telemetry configuration. Its broad environment-variable warning must be read alongside the dedicated data-source feature described earlier. Verify the actual telemetry destination independently. Its CSP instructions use browser errors to discover required Application Insights sources for connect-src, allow propagation time, refresh and recheck delivery. In Azure, inspect the appropriate resource's customEvents data.
For diagnosis, absence is weaker evidence than an observed failure. No event might mean the app never initialized, the logger was not reached, delivery was blocked, the wrong resource was queried, or the chosen time window excludes the run. Record a known test time and confirm the first observable stage. Do not conclude that an outage has ended solely because error events stopped arriving.
Browser Console and Network evidence connect these stages: an exception can explain why initialization stopped; a CSP message can explain why a request never reached its service; an actual response can redirect attention to the service or its caller. Capture only necessary diagnostics. Remove tokens, personal data and sensitive payloads from shared traces, and keep test telemetry small enough to control ingestion cost.
Troubleshooting Workflow: A Controlled Release Regression
Consider a hypothetical service-request dashboard that worked for its maker before promotion. After deployment to Test, an intended user can see the shell, cannot see request rows, and the operations team sees no new telemetry. There are at least two independent observations here. A telemetry repair alone would not establish that request data is accessible.
Use an isolated Test environment, a saved known-good source/build, a named solution, synthetic request rows, an intended-user identity and an administrator available for policy changes. Before reproducing, preserve deployment configuration and the existing CSP policy. Use read-only actions so a repeated click cannot submit duplicate business work.
- Confirm that the deployed app and solution are the intended release. Open it as the test user in the correct tenant/profile and record the time. If launch fails before the shell, return to Monitor and the earliest browser error instead of continuing with data diagnosis.
- Reproduce one list load with Network recording. If a request reaches the expected target and returns a permission denial, preserve its sanitized error and investigate that user's access. If no request appears, inspect the exception or policy evidence that prevented it. If rows return from the wrong target, compare the persisted data-source references with Test's variable values.
- Investigate telemetry separately. In this hypothetical branch, suppose the browser shows a connect-src violation for the configured telemetry destination while the data request receives an access denial. The evidence supports two fixes: an administrator reviews the necessary telemetry source, and the data owner reviews the user's required access. A broad CSP exemption cannot repair the data denial.
- Apply each correction separately in Test and repeat the same read-only action. Expected acceptance is that the intended user sees only the authorized synthetic rows, telemetry delivery no longer shows the relevant CSP violation, and the event appears in the intended resource/time window. Also retest a user who should lack data access: the release must preserve that denial.
- Repeat a fresh hosted launch and a representative interaction with enforcement enabled. Preserve before/after evidence and the exact changed settings. If a correction causes a new failure, restore the recorded app configuration or policy through the established release/change process and rerun the original acceptance test.
This is an illustrative reasoning exercise, not an executed lab or a promise of these exact errors. Its useful outcome is an evidence-backed separation of launch, data and telemetry. After testing, remove temporary shares and synthetic data, restore any diagnostic policy changes, and remove temporary instrumentation or resources that were created only for this investigation. Preserve sanitized evidence under the organization's retention rules.
Best Practices: Optimize the Measured Bottleneck
A useful performance comparison fixes the release, browser, user, dataset and interaction. Record both a fresh load and a repeat interaction; mixing cached and uncached runs can conceal the effect of a change. Define acceptance around a business action, such as when an authorized user can interact with the request list, rather than when the first decorative element appears.
Use browser Network timing and a Performance recording to decide what to optimize. These are recommended experiments, not platform guarantees:
| Observation in the controlled run | Candidate change | Evidence required before accepting it |
|---|---|---|
| Repeated equivalent reads during a single interaction | Remove duplicate triggers or coalesce equivalent in-flight reads | Fewer requests without stale rows, missed updates or changed authorization behavior |
| Large initial asset transfer and delayed first interaction | Defer optional screens/assets until needed | Smaller initial transfer and earlier interaction; deferred screens still load correctly |
| Requests finish promptly but the interface remains unresponsive | Reduce avoidable rendering/computation; test list virtualization for a large list | Less main-thread work while preserving keyboard access and visible results |
| One remote operation dominates elapsed time | Inspect its request shape, returned data and server-side evidence | Same business result with a measured reduction in wait; no hidden retry storm |
Optimize one cause at a time. Adding concurrency can reduce sequential waiting but increase pressure on a dependency. Caching can reduce traffic but create freshness and access problems. Set explicit invalidation and user-context boundaries before accepting either technique. If the evidence points beyond the app's request boundary, carry its sanitized timing/error context into the broader tracing process instead of guessing at backend changes here.
Re-run negative tests after a performance fix. A faster list that exposes an unauthorized row or silently omits a required update has failed the release outcome. Record the comparison conditions and observed improvement; do not invent universal timing targets or a successful benchmark.
Certification Relevance
Under the selected AB-400 scope verified on October 15, 2026, Extend the user experience includes deployment, sharing, CSP, monitoring and code-app optimization. The practical skill is choosing evidence that distinguishes a failed release from a failed launch or interaction. Practice explaining why each observation leads to one test and what result would disprove the suspected cause. This guide teaches those product skills without reproducing assessment questions or asserting live exam availability.
Conclusion
A defensible code-app release has explicit placement, tested end-user access and verified target configuration. A defensible repair identifies the failing boundary, changes only the implicated component and repeats both positive and negative tests. Keep startup evidence, browser policy, data responses and post-load telemetry connected in the investigation, while preserving their different meanings.
Authoritative Sources
- AB-400 study guide
- Create a code app using the Power Apps CLI
- Overview of pipelines in Power Platform
- Power Apps code apps overview
- Use environment variables in code app data sources
- Application lifecycle management for code apps
- Configure Content Security Policy for code apps
- Set up Azure App Insights for code apps